I am a Year 8 student at Saint Patrick's School in Auckland, NZ. I am in Room 8 and my teacher is Mrs Dines.
Monday 29 August 2016
Analyzing infomation represented in graphs
WALHT: create graphs using a spreadsheet and to analyse data in those displays.
Graph 1. Shows that over the week Adam has has been measuring how much rain has fallen. The most rain fell on Tuesday, the rain gauge showed that 7 mm of rain fell on that day,
Graph 2. This graph shows that Emily has been recording her weight over the past 12 months. To show how much her weighr increased as a result of the weight lifting she had done.
Comparing and Contrasting
WALHT: compare and contrast information from 2 articles to identify similarity and differences.
WALHT: use key ideas to synthesize.
Labels:
compare contrast,
differences,
Google drawing,
similarities,
synthesize
Friday 19 August 2016
Spelling Term 3
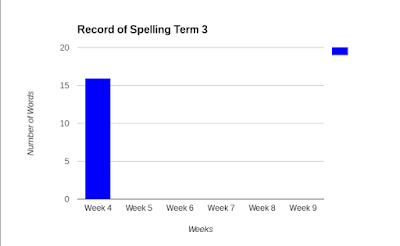
 The data shows that this Student began with a score of 15 and the following week dropped back to six. Consecutive weeks show marked improvement and consistency.
WALHT use a spreadsheet to enter and display data.
WALHT analyse and discuss data displays
Labels:
Google spreadsheet,
Records,
Spelling,
Term 3 Test
Monday 15 August 2016
The Feast of the Assumption
Today room 8 and I have been learning about the Assumption of Mary. A day we celebrate as catholic's when Mary is assumed into heaven.
Subscribe to:
Posts (Atom)


